Container prices decline at LA/LB, congestion continues, no link between reliability & freight rates
Container prices decline at LA/LB ports, global congestion continues, no link between reliability

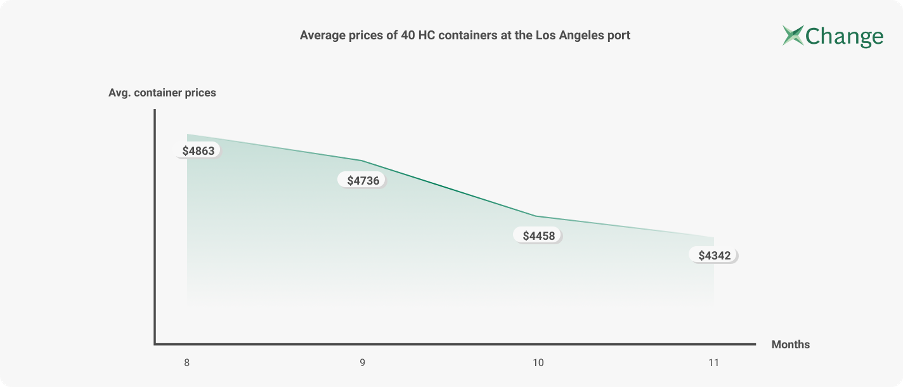
November 24, 2021: Container prices decline at LA/LB ports, global congestion continues, no link between reliability & freight rates The average price for 40 ft high cube containers dropped 11 percent from $4,863 in August to $4,342 in November at the port of Long Beach. At the port of Los Angeles, a 20 ft dry container costs $1,850 and a 40 high cube costs around $4,342 in November - a decline of nearly 11 percent. On a global scale, about 78 ports recorded Container availability index (CAx) values higher than 0.50 (the value of 0.50 represents the ideal balance of inbound and outbound containers), according to Container xChange, a global container trading and leasing platform. |
The average one-way container leasing pickup charges on China-United States stretch have also dropped after it peaked in September from $2,810 to $1,760 in October. |
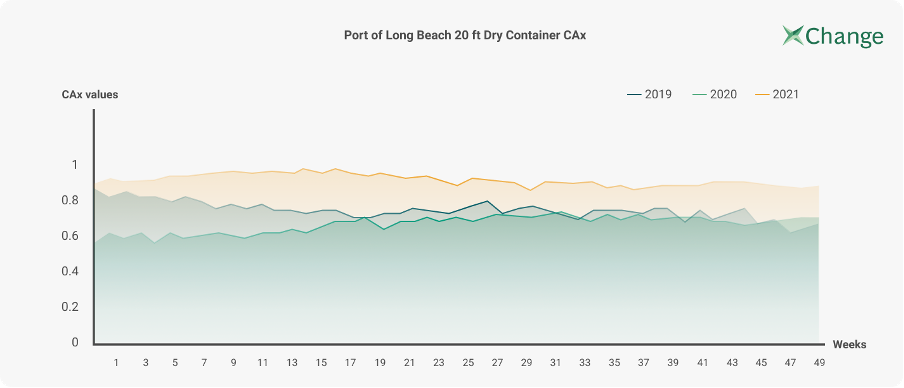
The CAx at the port of Long Beach is 0.88 this week, which is the highest since 2019. The CAx values stood at 0.67 in 2019 and 0.68 in 2020. |
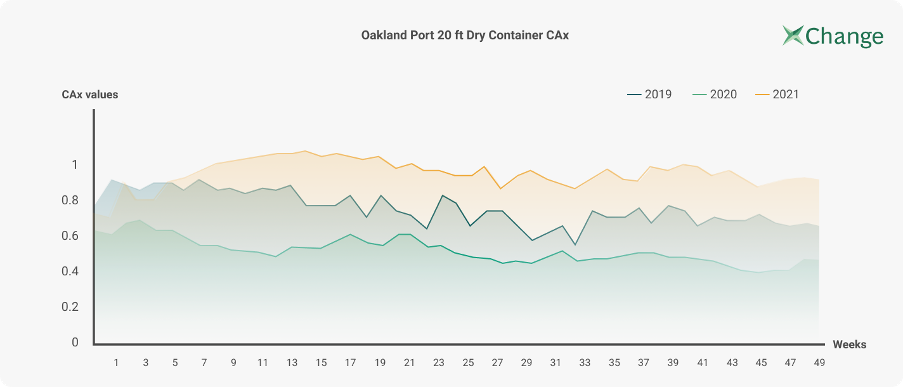
The situation is similar at ports like Oakland, Seattle, Tacoma, and other ports in the U.S West Coast. The port of Oakland, for example, showed CAx values between a range of 0.36 to a maximum of 0.65 throughout 2020 but is now in the range of 0.70 to 0.96 at any given week in 2021. |
At the port of Savannah, CAx stands at 0.94, which was 0.81 in 2020 and 0.84 in 2019 during the same week. Clearly, the port is handling a very high number of inbound containers this year compared to the past two years, Container xChange said in its report. “The United States, being an import destination of containers, has witnessed an extraordinary number of vessels this year as the demand grew exponentially, especially in the North America region,” said Dr. Johannes Schlingmeier, CEO and co-founder of Container xChange. “This has crippled the supply chain because the ports and the supporting ecosystem have not been prepared adequately. We need measures to collectively improve the situation at these ports, which has had a domino effect on other ports and in fact on the global supply chain. As per our forecast, the container prices will level off at a new normal that will be at least 2X of the pre-pandemic cost by the end of next year 2022.” No link between reliability and freight rates Reliability tends to improve when there is overcapacity as this makes it easier to adhere to schedule, according to Sea-Intelligence, a leading provider of research & analysis, data services, and advisory services. High reliability mainly occurs at points in time where rates are going down and not going up, said Alan Murphy, CEO, Sea-Intelligence. "We saw the same happen during the pandemic with schedule reliability going up during the early periods with low demand levels and high blank sailings, and schedule reliability dropping considerably as vessels started to sail fuller and berth congestion rose." Sea-Intelligence analysed seven port-pairs using its own schedule reliability data and freight rate data from World Container Index (WCI). For each of the port-pairs, they used a scatter plot showing the WCI on the y-axis and schedule reliability on the x-axis, also adding in a linear trend line and the coefficient of determination (R-squared) which shows the strength of the correlation. "For nearly all of the port-pairs, we saw that the R-squared value was low, denoting weak to no correlation. The only exception to this was Shanghai-Rotterdam (as shown in Figure 1), which had an R-squared value of 0.63. This means that roughly 63% of the variation in freight rates can be explained by changes in schedule reliability. However, the trend line is negative, which means that during periods with high schedule reliability, freight rates were low and vice versa." |